Monitoring Microservices via Graphite with Sensu: Part 1
For the past 2 years I’ve been been part of the team replacing ITV’s legacy systems with microservices hosted in AWS.
We’ve learnt a lot so far but certainly one of our biggest challenges to date has been implementing effective monitoring.
Effective monitoring is difficult - especially when put under the same scrutiny as any other code that ends up in production i.e. properly thought out, tested, promoted through environements etc. Indeed, previous monitoring efforts on historical projects were usually hastily done post-festum as an afterthought, leading to mixed results.
Like any modern platform we rely heavily on caching (via Varnish). We rely upon Varnish to cache both our metadata API (provided by Scala microservices) and static assets. An initial stab at monitoring our backends was done using RSpec tests and Sensu (see previous blog post). We ran a set of simple HTTP-based RSpec tests which queried our backends directly (i.e. not via the cache). This gave us a clear answer to “is service X up or down?”. More elaborate business-logic tests were also present in the test pack but were in the minority.
In theory this sounds like a reasonable approach: we knew exactly when and why a backend became unhealthy rather than when the cache decided it was (after n failed probes).
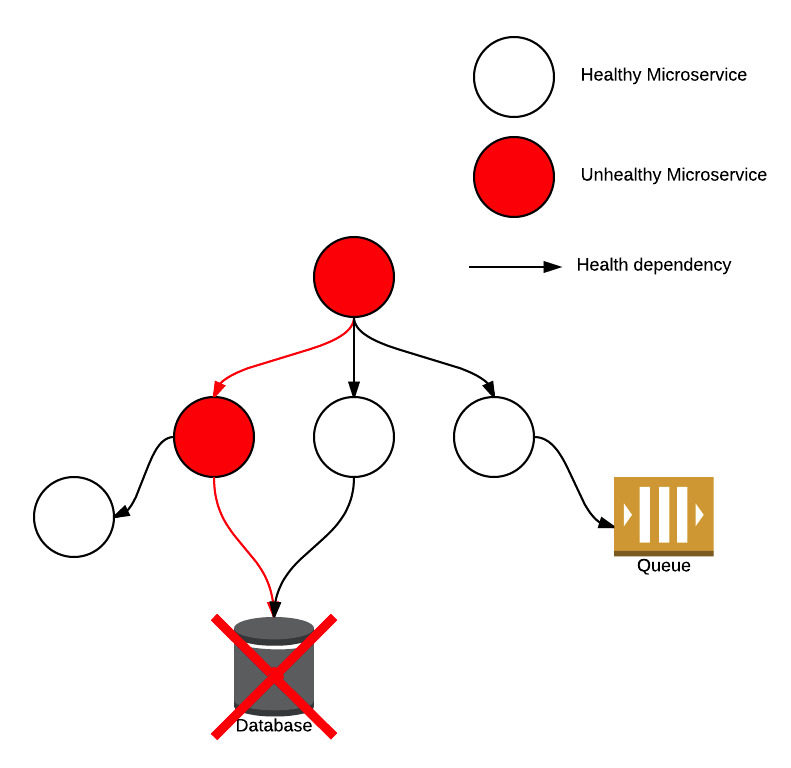
However, in reality, it’s not uncommon for individual health probes to fail. This can cause problems in microservice-based architecture due to the interconnected nature of the individual components: a failed connection between two microservices can not only impact the health of the directly dependent service but potentially cause a ripple-effect amongst indirectly dependent services.
In our experience, this is often due to networking issues in the cloud, between on-prem and the cloud and when interfacing with legacy systems not designed for the modern era. Kyle Kingsbury gives an excellent breakdown of problems that can occur with networks.
The short term impact was noisy and misleading PagerDuty alerts, which reduced confidence in our alerts. Left unchecked, the story of the boy who cried wolf and an uncomfortable postmortem for all involved becomes a real possibility.
Longer-term we were forced to re-evaluate how tightly integrated our microservices were and decide which were mission critical and which weren’t.
Re-think
A different solution was clearly needed; one that was more tolerant and realistic. We’ve covered the main problem with the previous alerts: frequency - a problem hugely exacerbated by the stateless nature of the running RSpec tests. Consequently, our requirements were:
- state (i.e. historical data)
- tolerance
- customisation (per backend)
We already exposed Varnish stats (varnishstats on the commandline) via the excellent
Sensu plugin provided by the community
to use in Grafana (a Graphite dashboard).
Our Graphite data is kept for 3 months so we have no shortage of historical data to play with!
Utilising Graphite’s fantastic API, all we had to do was think carefully about the function we provided in the API call and implement some fairly trivial rules for interpreting the subsequent response.
This new approach - whilst more technically challenging - was actually more straightforward. By relying upon Varnish’s definition of healthy/unhealthy backends meant that we did not have to duplicate (or keep pace with) complex probe logic per backend in the VCL. Ultimately, we don’t immediately care - from an alerting perspective - if a service has flickering health. Varnish will serve from grace in the interim and such flickering anomalies can be exposed more efficiently in dashboards.
Unanticipated Issues
Unfortunately we had a number of obstacles to overcome whilst designing our new Sensu check.
Firstly, the Varnish stats Sensu plugin is run quite often (every ten seconds) which makes Graphite API calls quite large depending on how much historical data you require and how many backends you have.
Secondly, incomplete data for a certain interval would return nil instead of a numerical value. This presented a
number of edge-cases.
Thirdly, how to treat load-balanced backends. Should we raise alerts as soon as one becomes unhealthy? Or should we wait until a certain percentage do? In the meantime, when and how loudly do we alert for these unhealthy (but non-critical) backends?
Lastly, and perhaps most importantly, AWS instances are frequently destroyed and recreated, resulting in stale metrics. These stale metrics are alerted on which causes much confusion.
Some of these issues were fairly trivial but some are still being ironed out.
I’m going to cover in more detail what we did in a subsequent blog post. This will include both the Graphite API function we used as well as a full breakdown of our custom Sensu check.
Comments
comments powered by Disqus