Special thanks to my colleague Efstathios Xagoraris, who laid the original foundations for this concept,
as well as the rest of the team at ITV for their valued input.
provides a common configuration to launch infrastructure — from physical and virtual servers to email and DNS providers. Once launched, Terraform safely and efficiently changes infrastructure as the configuration is evolved.
Here is an example which creates a VPC using a Terraform module
(similar to a class in a programming language).
However, what immediately struck me (coming from a development background) was the way that modules were referenced - i.e. specifying the module source within
the body of the module implementation.
Combining the module source with its use feels like a mix of concerns to me.
Additionally, each time you reference a module you must specify its source - even if you used that module elsewhere in your project.
I believe that abstracting the source location to another file (separate from the implementation) would make much more sense.
Specifying the version (e.g. a git tag) is great as it means multiple teams can contribute to the same Terraform modules without breaking functionality
for others.
However, upgrading even a single module in a project can be quite a laborious and manual process. Consider a setup with dozens or even
hundreds of ASGs (autoscale groups), spread across numerous .tf files and various environments (QA, SIT, Stage, Prod etc.) with each
using a Terraform module to implement said ASGs.
Any non-trivial project will require many other modules e.g. Security Groups, VPCs, subnets, Route53, EBS etc. - suddenly you have
a lot of things to change!
Terrafile
The combination of a mix of concerns with the module source and implementation with a potentially laborious and error prone module upgrade process resulted
in the creation of a Terrafile to address these issues.
A Terrafile is simple YAML config that gives you a single, convenient location that lists all your external module dependencies.
The idea is modelled on similar patterns in other languages - e.g. Ruby with its Gemfile (technically provided by the bundler gem).
Below is a simplistic example in Ruby/Rake of how you might implement the Terrafile pattern. No gems are required (except Rake of course).
Simply place the code in a Rakefile and execute using rake get_modules.
require'yaml'require'fileutils'# You may want to change this.defmodules_path'vendor/modules'end# You may want to change this.defterrafile_path'Terrafile'enddefread_terrafileifFile.exist?terrafile_pathYAML.load_fileterrafile_pathelsefail('[*] Terrafile does not exist')endenddefcreate_modules_directoryunlessDir.exist?modules_pathputs"[*] Creating Terraform modules directory at '#{modules_path}'"FileUtils.makedirsmodules_pathendenddefdelete_cached_terraform_modulesputs"[*] Deleting cached Terraform modules at '#{modules_path}'"FileUtils.rm_rfmodules_pathenddesc'Fetch the Terraform modules listed in the Terrafile'task:get_modulesdoterrafile=read_terrafilecreate_modules_directorydelete_cached_terraform_modulesterrafile.eachdo|module_name,repository_details|source=repository_details['source']version=repository_details['version']puts"[*] Checking out #{version} of #{source} ...".colorize(:green)Dir.mkdir(modules_path)unlessDir.exist?(modules_path)Dir.chdir(modules_path)do`git clone -b #{version}#{source}#{module_name} &> /dev/null`endendend
Implementation
Implementation is quick and easy. We’ve covered most of it already but let’s recap.
Create your Terrafile.
Implement a way to read your Terrafile and fetch the required modules (working Ruby example above).
Modify all source variables in your Terraform project to point to your new cached modules directory (provided by the modules_path method above)
rather than GitHub e.g.
If you need to support multiple different versions of the same module (an incremental upgrade for instance), the Ruby/Rake implementation
above takes the Terrafile key name into account. For example, the following will be deployed to vendor/modules/vpc-0.0.1 and
vendor/modules/vpc-2.0.0 respectively.
Additionally, the deletion and subsequent fetching of the Terrafile modules is very simplistic. Each time rake get_modules is executed, all cached
modules are removed and re-fetched.
Conclusion
It feels repetitive and prone to error to keep specifying modules and their version information, especially for larger teams who share
modules. Terraform is rapidly evolving - to keep up you must frequently update your modules.
Probably my favourite aspect of using a Terrafile is being to see at a glance exactly which modules and which versions are being used
by a project, just like a Gemfile or a Puppetfile. Outdated or buggy dependencies are often the root cause of runtime issues and
this shortens the debugging and investigation considerably when things go wrong.
I’m a huge fan of Terraform and other Hashicorp products (especially Consul and Vagrant). I hope this design pattern helps others to use
Terraform even more productively.
For the past 2 years I’ve been been part of the team replacing ITV’s legacy systems with microservices hosted in AWS.
We’velearntalot
so far but certainly one of our biggest challenges to date has been implementing effective monitoring.
Effective monitoring is difficult - especially when put under the same scrutiny as any other code that ends up in
production i.e. properly thought out, tested, promoted through environements etc. Indeed, previous monitoring efforts
on historical projects were usually hastily done post-festum as an afterthought, leading to mixed results.
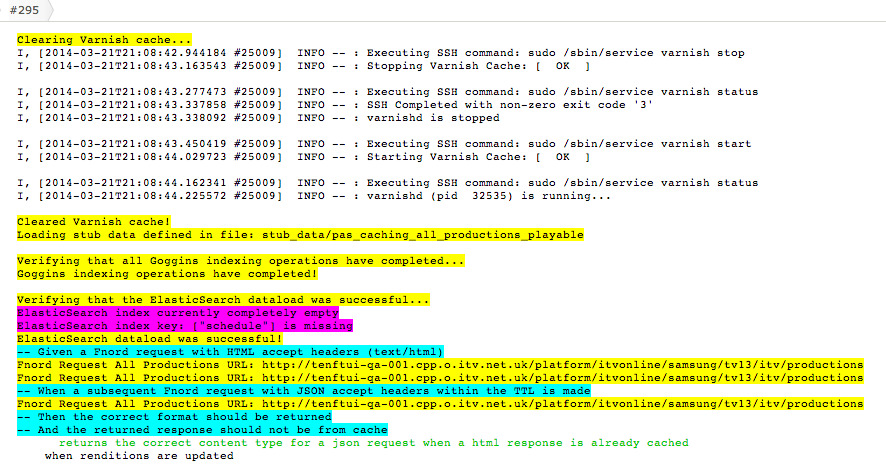
Like any modern platform we rely heavily on caching (via Varnish). We rely upon Varnish to cache both our metadata API
(provided by Scala microservices) and static assets. An initial stab at monitoring our backends was done using RSpec
tests and Sensu
(see previous blog post).
We ran a set of simple HTTP-based RSpec tests which queried our backends directly (i.e. not via the cache). This gave
us a clear answer to “is service X up or down?”. More elaborate business-logic tests were also present in the test
pack but were in the minority.
In theory this sounds like a reasonable approach: we knew exactly when and why a backend became unhealthy rather than
when the cache decided it was (after n failed probes).
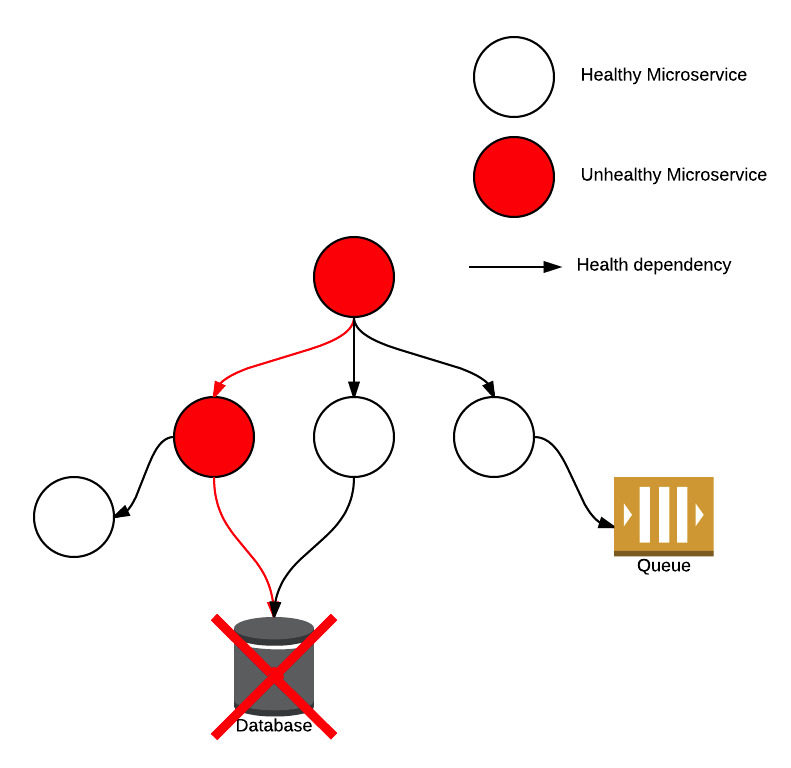
However, in reality, it’s not uncommon for individual health probes to fail. This can cause problems in
microservice-based architecture due to the interconnected nature of the individual components: a failed connection
between two microservices can not only impact the health of the directly dependent service but potentially cause a
ripple-effect amongst indirectly dependent services.
The microservice health ripple-effect
In our experience, this is often due to networking issues in the cloud, between on-prem and the cloud and when
interfacing with legacy systems not designed for the modern era. Kyle Kingsbury gives
an excellent breakdown of problems that can occur with networks.
The short term impact was
noisy and misleading PagerDuty alerts, which
reduced confidence in our alerts. Left unchecked, the story of the boy who cried wolf and an uncomfortable postmortem
for all involved becomes a real possibility.
Longer-term we were forced to re-evaluate how tightly integrated our microservices were and decide which were mission
critical and which weren’t.
Re-think
A different solution was clearly needed; one that was more tolerant and realistic. We’ve covered the main problem with
the previous alerts: frequency - a problem hugely exacerbated by the stateless nature of the running RSpec tests.
Consequently, our requirements were:
state (i.e. historical data)
tolerance
customisation (per backend)
We already exposed Varnish stats (varnishstats on the commandline) via the excellent
Sensu plugin provided by the community
to use in Grafana (a Graphite dashboard).
Our Graphite data is kept for 3 months so we have no shortage of historical data to play with!
Utilising Graphite’s fantastic API, all we had to do was
think carefully about the function we provided in the API call and implement some fairly trivial rules for interpreting
the subsequent response.
This new approach - whilst more technically challenging - was actually more straightforward. By relying upon Varnish’s
definition of healthy/unhealthy backends meant that we did not have to duplicate (or keep pace with) complex probe
logic per backend in the VCL. Ultimately, we don’t immediately care - from an alerting perspective - if a service has
flickering health. Varnish will serve from grace in the interim and such flickering anomalies can be exposed more
efficiently in dashboards.
Unanticipated Issues
Unfortunately we had a number of obstacles to overcome whilst designing our new Sensu check.
Firstly, the Varnish stats Sensu plugin is run quite often (every ten seconds) which makes Graphite API calls
quite large depending on how much historical data you require and how many backends you have.
Secondly, incomplete data for a certain interval would return nil instead of a numerical value. This presented a
number of edge-cases.
Thirdly, how to treat load-balanced backends. Should we raise alerts as soon as one becomes unhealthy? Or should we wait
until a certain percentage do? In the meantime, when and how loudly do we alert for these unhealthy (but non-critical)
backends?
Lastly, and perhaps most importantly, AWS instances are frequently destroyed and recreated, resulting in stale metrics.
These stale metrics are alerted on which causes much confusion.
Some of these issues were fairly trivial but some are still being ironed out.
I’m going to cover in more detail what we did in a subsequent blog post. This will include both the Graphite API
function we used as well as a full breakdown of our custom Sensu check.
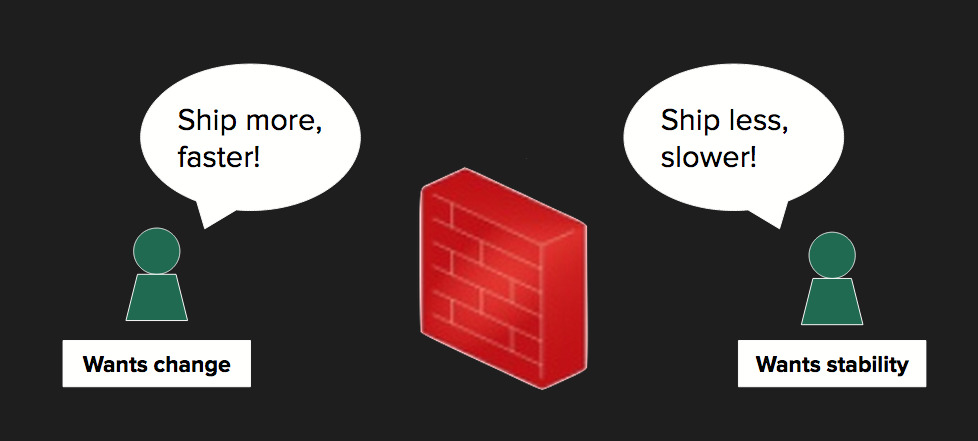
Despite agile, cross-functional product teams there is often still a clear separation between Engineering (development and testing functions) and Operations.
Assuming a Continuous Delivery pipeline, there is strong collaboration between the three areas in local (e.g. Vagrant), test and stage environments.
However, when it comes to the production environment, Operations typically have the keys to the castle (complete with moat and drawbridge).
This isn’t necessarily a bad thing - roles and responsibilities are clearly defined for good reason.
But it does help reinforce the Engineering-Operations divide of “we build it, you run it”.
[1] Metrics by coda hale : to know your app’ health - Izzet Mustafaiev
Shared Responsibility
A tangible way to help bridge this divide is with a set of behaviour-driven infrastructure tests.
The idea is to run a set of tests at regular intervals across all environments (especially Production) to monitor your application from a behavioural perspective.
When tests fail, they raise very specific errors regarding your application. The benefits here are twofold:
It enables Operations’ to understand the application behaviour.
It improves Engineering’s understanding of how the environment effects the application.
Over time, this leads to increased collaboration between two teams that tend to be deeply entrenched.
Operations will be exposed to very specific alerts when tests fail which they can feed back to the Engineering team (e.g. service X has gone unhealthy because it depends on service Y which has lost database connectivity).
They can also suggest - and contribute - new tests for missed or problem areas.
The Engineering team can understand how their application works at scale in a complex environment (e.g. with load-balancing, caching, multiple instances).
This can aid troubleshooting complicated edge-cases such as message queuing, race conditions and cache invalidation which may be difficult to simulate locally.
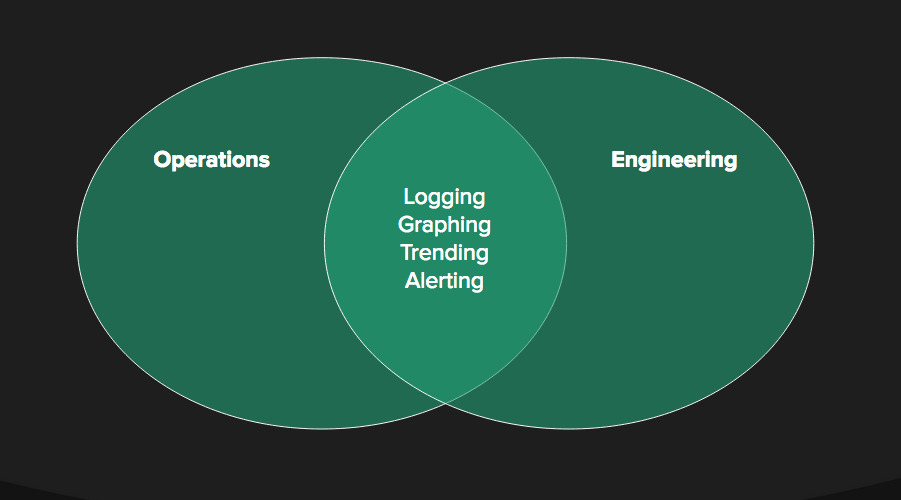
The goals of universal logging, graphing, trending and alerting are strong drivers for both teams, helping to expose, debug and fix issues.
[2] Metrics-Driven Engineering - Mike Brittain
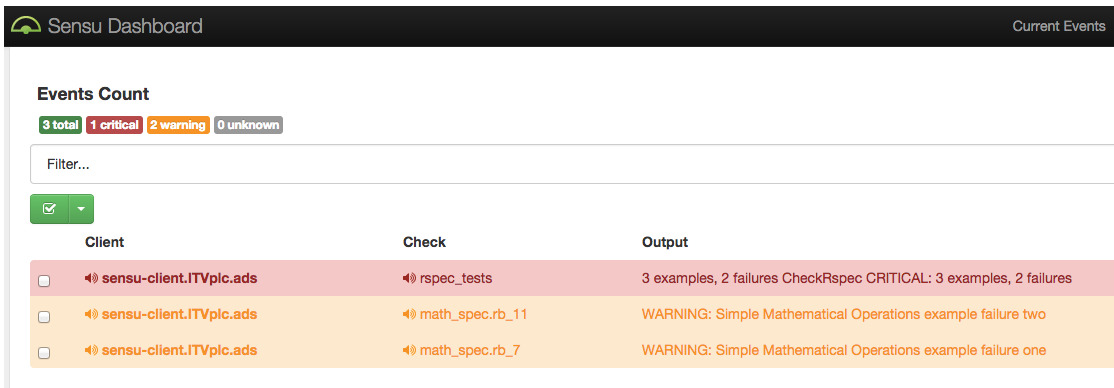
Introducing Sensu
Sensu is an open-source monitoring framework designed with the cloud in mind. Taken straight from the documentation:
Sensu takes the results of “check” scripts run across many systems, and if certain conditions are met; passes their information to one or more “handlers”. Checks are used, for example, to determine if a service like Apache is up or down. Checks can also be used to collect data, such as MySQL query statistics or Rails application metrics. Handlers take actions, using result information, such as sending an email, messaging a chat room, or adding a data point to a graph.
From my experience of using Sensu for the past few months across all ITV’s AWS environments (including Production), I can confirm that it’s a really awesome tool.
It’s much more powerful, configurable and easy-to-use than Zabbix or Nagios.
Sensu provides an open-source repository which contains a large number of “checks” and “metrics” which you can use. You can also use any existing Nagios plugins that you might have.
You can fully configure Sensu using Puppet or Chef (we use the former).
It also provides an API which also allows you to configure different dashboards e.g. Uchiwa.
A Working Example
Let’s take a look at how you can run your infrastructure tests and raise alerts for failures.
At ITV, we verify the behaviour of our Scala micro-service API using core Ruby and RSpec. In order to
Continuously Deliver changes to
each micro-service, we test individual commits (forming a “candidate service”) in isolation against its proven stable
counterparts (from prior runs of this very process).
Consequently, test failures can usually be narrowed down to a failure in an individual micro-service or in the contract
between two or more micro-services.
As we use Logstash/Kibana across our
environments, we can supplement test failures with a holistic view of the system when those failures occurred.
Of course we only want to see the Kibana logs that encompasses the failed test (and all relevant hooks), otherwise we’ll
just be dealing with noise.
RSpec Hooks
In order to solve our problem, we need to do the following:
Initialise a variable with the time before the entire test suite begins.
Update the variable after each individual test (so that all before test hooks are taken into account).
Use the variable defined in (1) if it’s the very first test that fails or (2) if it’s for any test afterwards.
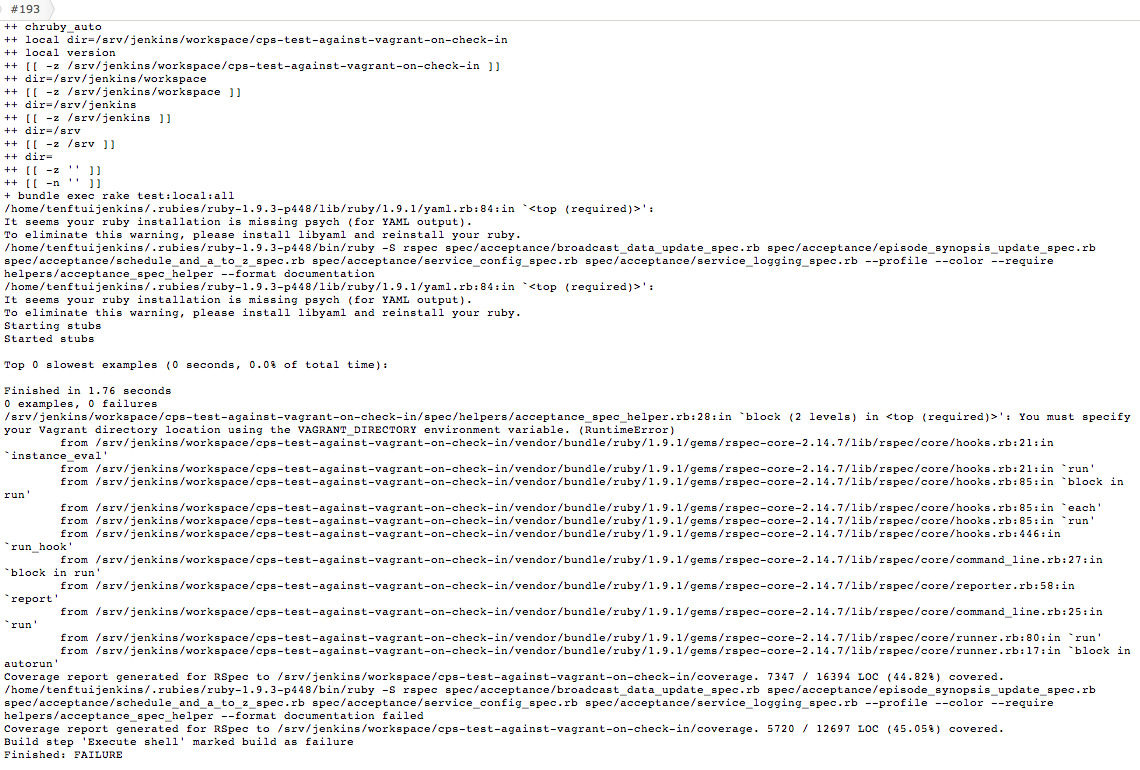
Unfortunately, the before(:suite) hook - which, as the name implies, runs once before your entire suite of tests -
does not allow instance variables defined in that scope to be used in your tests.
This now works but will result in Ruby runtime warnings every time the class variable is accessed:
/Users/bensnape/git/CPS/spec/helpers/unit_spec_helper.rb:27: warning: class variable access from toplevel
So not the ideal solution.
Enter class_variable_set
Instead, using Ruby metaprogramming and class_variable_set we can modify a variable that holds a timestamp in a class
that hasn’t been created yet.
When we do need to create an instance of this class (i.e. when we get a test failure), it will be initialised with the
timestamp from the last after hook (or from the intial before(:suite) hook if the very first test fails):
classGlobalDateTime@@start_time=Time.nowdefstart_time@@start_timeendendRSpec.configuredo|config|config.before(:suite)doGlobalDateTime.class_variable_set(:@@start_time,Time.now)endconfig.after(:each)do|example|ifexample.exceptiondate_format='%Y-%m-%d %H:%M:%S'kibana_url='http://logstash.cpp.o.itv.net.uk/kibana/#/dashboard/elasticsearch/All%20Microservices%20By%20Date?'times={from: GlobalDateTime.new.start_time.strftime(date_format),to: Time.now.strftime(date_format)}kibana_url<<times.map{|type,timestamp|"#{type}=#{URI::encode(timestamp)}"}.join('&')puts"Check the server logs at: #{kibana_url}"endGlobalDateTime.class_variable_set(:@@start_time,Time.now)endend
Alternatively, you can change start_time to be a class method instead:
defself.start_time@@start_timeend
Which means that you can use start_time directly on the GlobalDateTime class, rather than creating a new instance
first:
In software development, I often find that the simplest tools are the most valuable. If you’ve worked with RabbitMQ
before you’ll know what I mean (joke, Rabbit lovers).
I’ve been working on implementing a microservice-based API at
ITV for around 18 months now. It’s been an interesting departure from the typically monolithic
systems I’ve worked with in the past. However, despite numerous benefits, microservices offer their own unique
challenges when it comes to testing the system as a whole.
Interactions and dependencies between each individual - or group of - microservices can be tricky to negotiate. Even
with thorough knowledge of the underlying domain, system-wide acceptance test failures could be due to any number of
reasons and can be tiresome to debug.
In such cases, the best approach is to methodically debug the system, gradually becoming more hands-on. For example,
tailing application logs, reading exceptions (if any) and inspecting access logs should come after more fundamental
checks such as are all the expected services even running and healthy?
With this in mind, I wanted a simple, no-frills, graphical URL status checker.
It turned out that no such thing existed(at least I couldn’t find anything) so I created one.
Initial Development
Eir, in Norse mythology is a goddess of health which I thought was appropriate.
I sat on my idea of an easy-to-use status checker for some time as I wasn’t quite sure how I was going to architect it.
I’ve used Sinatra extensively for creating standalone system mocks and eventually I
realised that the answer had been staring me in the face all along.
I found a great Sinatra and AJAXscreencast
which helped point me in the right direction.
Defining custom RSpec matchers is really easy and a great way to increase the readability of your tests.
Using your own matcher is a much better option rather than trying to retrofit RSpec’s built-in matchers to fit your
individual use case.
A retro-fitted example
You may want to check that a HTTP response has a particular status code. Using RSpec’s built-in matchers would look
something like this:
it'should return a 200 status code'do# we need the block at the end to prevent non-200 status codes being raised as an error automaticallyresponse=RestClient.get('http://bensnape.com/missing-page'){|response,request,result|response}expect(response.code).toeq200# or response.code.should == 200end
But it would read much better with a custom have_status_code matcher.
it'should return a 200 status code'doresponse=RestClient.get('http://bensnape.com/missing-page'){|response,request,result|response}expect(response).tohave_status_code200# or response.should have_status_code 200end
Ultimately, all we’re really checking is that the status code of a HTTP request returns a certain value.
Providing a custom error message
We can improve our matcher further with a custom exception message. This is where the usefulness of writing your own
matcher really comes out, as it provides an exact, bespoke error message rather than something generic like
"expected false but got true" which we’ve all experienced at some point.
Simply extend the matcher above with a failure_message:
require'rspec/expectations'RSpec::Matchers.define:have_status_codedo|expected|matchdo|actual|actual.code==expectedendfailure_messagedo|actual|"expected that #{actual} would have a status code of #{expected}, but got #{actual.code} instead"endend
When this fails, the error looks like this:
Failure/Error:expect(response).tohave_status_code200# or response.should have_status_code 200expectedthat(entirepagecontentshere!)wouldhaveastatuscodeof200,butgot404instead
Which is useful as it adds more context to the test failure.
Extending our custom matcher further
Our custom matcher does the job but there are some potential problems with it.
Perhaps you are using more than one HTTP framework in your tests or - more likely - you are using the
Rack::Test framework for unit-testing Sinatra apps as well as an HTTP framework
such as RestClient, Curb or HTTParty for integration or acceptance tests for example.
In such cases it would be a good idea to use the same custom matcher defined above for all cases
(DRY). However, the APIs can differ e.g. to return the status
code, RestClient uses .code whereas Rack::Test uses .status.
Let’s harness the power of Ruby’s metaprogramming using respond_to? to handle this.
Of course, the more HTTP frameworks you have the more complexity is introduced.
It is probably a good idea to tighten up that if statement with an elsif for Rack::Test and a catch-all else
that raises an UnsupportedHTTPFrameworkException or similar.
Let’s finish up with our new failure_message.
RSpec::Matchers.define:have_status_codedo|expected|status_code=nil# define this here for visibility in the failure_message scopematchdo|actual|status_code=actual.respond_to?(:code)?actual.code:actual.statusstatus_code==expectedendfailure_messagedo|actual|"expected that #{actual} would have a status code of #{expected}, but got #{status_code} instead"endend
To provide a single error message we needed to introduce the status_code variable and ensure it was at a scope that
made it available to the failure_message block. This gave us the opportunity to use the much terser ternary operator
and split out the fetching of the status code from the matcher comparison.
For tests that run in complex applications and/or complex environments, the test failure alone often does not provide
enough information to conclusively diagnose the underlying issue.
Therefore, it’s handy to be able to intercept failed tests and provide extra debug information.
There are a couple of ways you can configure the after hook, depending on your use-case.
Generic after failure hook
This is an easy way to provide default debug output for every test failure (e.g. a snapshot of the current state of the
application/environment, timestamps etc.).
RSpec 3:
Rspec.configuredo|config|config.after(:each)do|example|ifexample.exception# do somethingendendend
RSpec 2:
Rspec.configuredo|config|config.after(:each)doif@example.exception# do somethingendendend
Specific after failure hook
There are bound to be certain special-cases in your tests which are especially tricky to debug. In situations like this
you can simply specify an example-level after hook in your spec file:
RSpec 3:
after(:each)do|example|ifexample.exception# do somethingendend
RSpec 2:
after(:each)doif@example.exception# do somethingendend
Until recently, I wasn’t really aware of the concept of having multiple private/public SSH key pairs in order to access different systems. As a developer, I’ve obviously used SSH fairly frequently over a number of years but it’s been more to get things done, e.g. setting up my GitHub account or connecting to some server at work once in a blue moon.
Typically, I would have a single pair of keys which I would use in all cases. So, my public key would be held by GitHub, my Mac server, my Gerrit server, Jenkins, TeamCity and so on. If I lost my private key it wouldn’t be a terrible loss - most of the systems I use are only accessible on the company intranet and are easily changed. I now know this is not the most secure setup (hey, I’m no sysadmin) but I also know that I’m not the only person doing this!
So what happens when we want to SSH onto a machine using a different key pair?
Manually managing multiple private keys
Let’s assume you’ve already set up new key pairs in your ~/.ssh directory. If you ls in that directory, you might see something like this:
$ ls ~/.ssh/

jenkins  jenkins.pub  github  github.pub  known_hosts
When SSH’ing onto a server - e.g. Jenkins - you would usually just type $ ssh user@host and be done with it (assuming you have the default id_rsa and id_rsa.pub keys in your ~/.ssh/ folder).
Because we now have separate keys for each server, we must specify the location of the corresponding private key (in your ~/.ssh/ directory) when we attempt to SSH onto the server with the -i flag:
$ ssh -i ~/.ssh/jenkins ben.snape@jenkins.itv.com
This does the trick but it’s very… wordy. Surely we can shorten it?
Introducing SSH config
Fortunately, there is a simple way to do this.
We can define a config in our SSH directory. The format looks like this:
Host           short-name
HostName       some.very.long.server.name
IdentityFile   ~/.ssh/private_ssh_key
User           username-on-remote-server
You can specify as many hosts as you like. Also, you may not need the User field depending on your use-case.
Let’s fill this out with my example Jenkins login from above and test it out:
Host           jenkins
HostName       jenkins.itv.com
IdentityFile   ~/.ssh/jenkins
User           ben.snape
While reading Hacker News I came across a very interesting blog post which contained a small discussion based on a Tech Talk by Google about how and why you should avoid if statements and switches through polymorphism.
The basic premise is that if you are repeatedly checking if an object is a type of something or if some flag is set then you’re probably violating one of the fundamental concepts of Object-Oriented Programming. Rather than introducing (complicated and/or cryptic) logic for a generic and incohesive class, it is advisable to implement a concrete subclass of an abstract superclass.
Ultimately, you should be trying to implement each fundamental OOP concept (SOLID) - pragmatically of course, as over-engineering a solution is just as poor practise.
Why Should We Do This?
The main benefits (taken from the Tech Talk slides) are threefold:
Functions without ifs are easier to read
Functions without ifs are easier to test
Polymorphic systems are easier to maintain (and extend) - again, refer to the Open/Closed Principle
An Example
I’m going to adapt a non-production code (i.e. test code) refactor I recently worked on.
My main responsibility is to look after ITV’s (exposed) back-end systems, including Mercury, our video content playlist service. Given a production ID and the client platform (e.g. DotCom for ITVPlayer.com, Android for the ITV Android app etc.) then Mercury returns the requested piece of content. The platform part is important as Mercury handles many platform-specific things such as lower content bitrates for the mobile platforms and higher bitrates for YouView and the ITVPlayer site, for example.
So of course, it is necessary to test that platform-specific things work on the intended platforms only.
The wrong way fast way to complexity and technical debt
Here’s a basic scenario that I’ve already given some background on above:
Pretty straightforward. Now we can implement these steps quite naively:
Given/^I request the Mercury playlist for (\w+)$/do|platform|@savon_client=@mercury.create_clientproduction=@production_helpers.get_production_from_configplatform@response=@mercury.playlist_request(@savon_client,production,platform)endThen/^I get the correct bitrates for (.*)$/do|platform|found_bitrates=@response.xpath('//VideoEntries/Video/MediaFiles/MediaFile').map{|node|node.attr('bitrate').to_i}expected_bitrates=caseplatformwhen/android/ithen[150000,300000,400000,600000,800000,1200000]when/samsung/ithen[1200000]when/youview/ithen[1200000]when/ps3/ithen[800000]when/mobile/ithen[400000]else[400000,600000,800000,1200000]endfound_bitrates.should=~expected_bitratesend
I think it’s implementations like this that give tools like Cucumber and its proponents a bad name. The step implementations are littered with conditional logic, unnecessary passing through of variables to various classes and a significant number of instance variables (compared to local variables).
Refactoring and removing the conditional logic
A much better approach is to properly model your domain (yes, even with testing).
Platforms are objects and should be treated as such. Mercury is also an object but it should be part of platform objects in a has-a relationship.
Let’s refactor our code from above starting with the Cucumber feature:
The plan is to have a data (platform object) instantiation pre-condition in the Given step, before having generic When and Then steps which will harness our new object-oriented design.
The new steps can be simply re-written (note the meta-programming in the Given step):
Given/^I have a piece of (\w+) catchup content$/do|platform|@platform=Object::const_get(platform.downcase.camelcase).newendWhen/^I request the Mercury playlist$/do@platform.request_playlistendThen/^I get the correct bitrates$/do@platform.playlist_response.bitrates.should==@platform.bitratesend
Now we need our platform base class. The idea here is to define generic platform behaviour which the individual subclasses can override if required.
As a result of this new design, it is so easy to see the generic and specific behaviour for each platform. Not only that, but the test code itself is much easier to write, maintain and read. I’ve no doubt that any developer could come in and quickly get up and running.
I’ve deliberately left out the Mercury classes as they could contain some commercially sensitive information (especially the stuff around adverts). With that aside, the Mercury response class was a really important refactor as it encapsulates all the tricky xpaths and regular expression parsing of the SOAP response in one place. Again, for any platform-specific behaviour it was just a case of creating a concrete subclass of Mercury::Response to implement the differences.
Staying Out of Trouble
There is always a fine line between meaningful concrete subclassing that aids understanding versus runaway subclassing and getting caught in an inheritance nightmare.
Base (abstract) classes are a Ruby anti-pattern, yet are embraced by the Java community.
Indeed, in statically typed languages there can be lots of boiler plate code which is ripe for inheritance. However, unless you’re a fairly experienced developer who is deft with an IDE then it’s so easy to become entangled amongst so many interfaces and implementations that you don’t know which way is up (I know because I’ve been in that situation before).
Final Thoughts
The concept of complete if-less programming has certainly left an impression on me. Not that I didn’t know that having good OO principles was desirable when designing software, I simply wasn’t aware that there was a movement around this concept.
I think that it’s easy - especially when writing non-production code - to subscribe to a ‘hack away’ mentality rather than properly think things through. Deadlines are often tight, testers are often lacking experience in writing clean, maintainable code and developers tasked with writing tests don’t always take it up with enthusiasm.
But the fact remains that there is probably no better way of describing your system than through a solid set of BDD OO tests.